


Every distributor knows the painful pattern: a player who deposited regularly for months suddenly goes silent. You send a message, they do not respond. You wait, they never return. By the time you noticed they were leaving, they were already gone. This is the silent churn problem, and it is the single largest revenue leak in sweepstakes distribution. The fix lies in panda master online game analytics—AI-driven churn prediction that identifies at-risk players before they decide to quit, giving distributors the window to intervene and recover them. This guide explains how churn prediction works and how distributors use it to protect their player base.
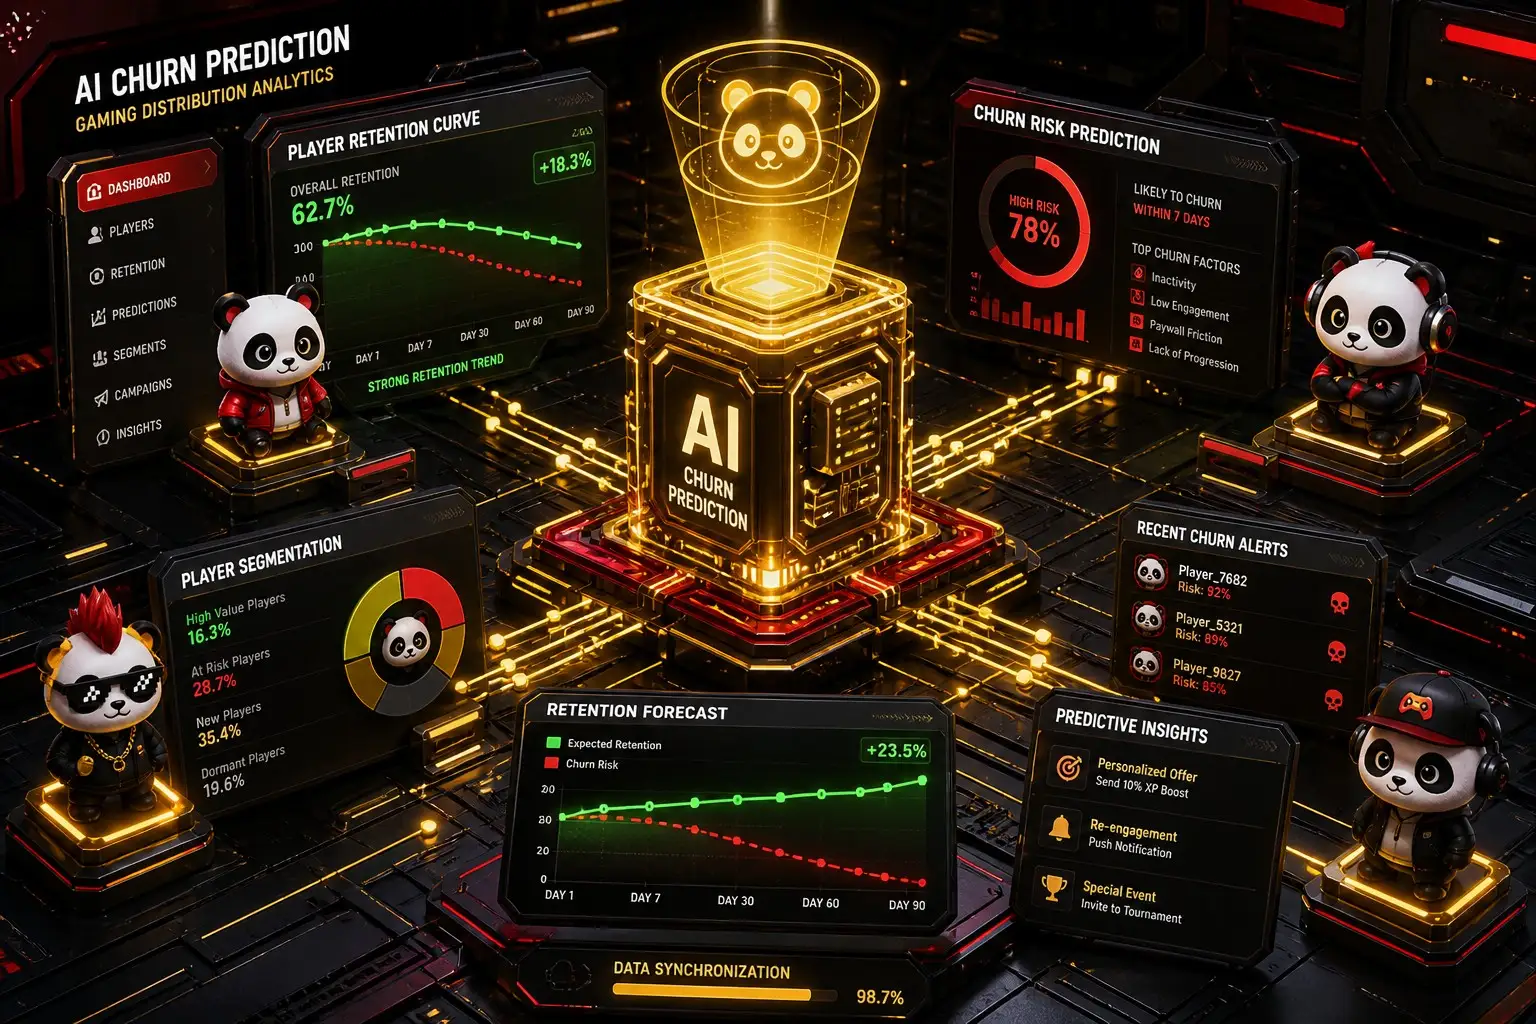
Why Players Churn Without Warning
Player churn is rarely a sudden decision. It is the end of a behavioral decline that began weeks earlier. The signals are subtle but measurable: a player who once logged in daily now skips two days; a player who bet at a consistent level now stakes half as much; a player who played for an hour now leaves after twenty minutes. Individually, these shifts seem minor. Collectively, they are a prediction. The challenge has always been that a distributor managing hundreds of players cannot watch every signal for every player. AI can.
How Panda Master Predicts Churn
1. Behavioral Pattern Analysis
The panda master online game platform continuously records behavioral telemetry for every player: session frequency, session duration, stake levels, game preferences, and win/loss patterns. The churn model analyzes these streams to detect deviation from each player’s own historical baseline—not a generic average, but their personal pattern. A deviation that would be invisible in aggregate becomes a clear signal at the individual level.
2. Risk Scoring and Segmentation
Every player receives a dynamic churn-risk score, updated as their behavior changes. The system segments the player base into risk tiers: stable, watch, and at-risk. Distributors see a single dashboard where at-risk players are flagged with the reasons behind the score, such as declining session frequency or post-loss withdrawal patterns. This turns the abstract concept of churn into a concrete, prioritized list.
3. The Intervention Window
The critical insight from churn analytics is timing. Data across distributor networks shows that the recovery window—the period during which a departing player can still be brought back—is typically 7 to 14 days after the first negative signal. Panda Master’s churn alerts are designed to fire within this window, sending the distributor an actionable notification while the player is still reachable. A targeted outreach in that window recovers a meaningful share of at-risk players.
From Alerts to Action: The Recovery Playbook
Prediction without action is just a warning. Distributors pair churn alerts with structured recovery playbooks:
- Personalized outreach: A direct message referencing the player’s favorite game and recent activity, not a generic “we miss you.”
- Targeted reload offers: A comeback credit sized to the player’s historical stake level, delivered with a clear expiry to create urgency.
- Game-specific re-engagement: An invitation to a feature or title the player historically loved, reminding them of the experience they enjoyed.
- VIP status protection: For high-value players, a reminder that their tier benefits are waiting, reinforcing what they would lose by leaving.
Distributors who run this playbook consistently report recovering 20-30 percent of at-risk players—revenue that would otherwise have been lost entirely.
The Economics of Churn Prediction
The return on investment for churn analytics is among the clearest in the industry. Acquiring a new depositing player costs several times more than retaining an existing one. A distributor with 500 active players who reduces monthly churn by 10 percent gains roughly 50 retained players—at an acquisition cost of zero. Over a year, that compounds into significant incremental GGR. The feature does not just save revenue; it changes the growth equation from constant replacement to compounding retention.
Implementation for Distributors
- Enable analytics: Activate the churn prediction module on the panda master online game dashboard.
- Define risk thresholds: Set the alert sensitivity based on your player base size and operational capacity to respond.
- Build your playbook: Draft the outreach messages and offers before you need them.
- Review weekly: Dedicate a weekly session to reviewing at-risk players and executing recoveries.
- Measure results: Track recovery rates and refine the playbook based on what works for your specific base.
Case Pattern: The Distributor Who Recovered 25% of At-Risk Players
The practical impact of churn prediction is best illustrated by a case pattern observed across Panda Master distributor networks in 2025-2026. One mid-sized distributor with roughly 400 active players had accepted churn as an operating cost: every month, a portion of the base stopped returning, and the distributor replaced them through acquisition. The economics were quietly draining—acquisition was the single largest expense line, and the operation was running hard just to stand still.
The change came when the distributor enabled the churn prediction module and built a simple weekly recovery routine. Every Monday, the distributor reviewed the at-risk list, which typically contained 15-25 players flagged for declining frequency or stake patterns. The outreach was targeted: a personal message referencing the player’s favorite game, and where appropriate, a reload offer sized to their historical stake level. No mass messaging, no generic bonuses—just relevant, timely contact during the recovery window.
Within 60 days, the distributor was recovering roughly 25 percent of flagged players each cycle. That recovery rate converted into meaningful incremental GGR, because retained players continued depositing month after month. More importantly, the distributor’s acquisition cost per new player remained the same, but the total player base stopped shrinking. The operation moved from replacement mode to compounding mode, and the economics of the network transformed.
The general lesson from this pattern is consistent: churn prediction does not require complex data science or large teams. It requires the visibility the AI provides and the discipline of a weekly recovery routine. The platform does the analysis; the distributor does the relationship work. That division of labor is exactly how retention becomes a competitive advantage rather than a chronic leak.
Frequently Asked Questions
How does churn prediction handle new players with no history?
New players are scored against cohort baselines—patterns from similar players in their first weeks of activity. As their personal history accumulates, the model shifts to individual baselines. This dual approach ensures prediction works from the very first session.
Does this require me to understand data science?
No. The panda master online game analytics dashboard presents everything in plain language: player names, risk levels, and suggested actions. The AI does the modeling; you do the relationship-building. No technical expertise is required.
Will chasing every at-risk player annoy my base?
Only if outreach is generic and excessive. The system is designed for targeted, personalized contact within the recovery window, not mass messaging. Distributors who follow the playbook—relevant message, appropriate offer, respectful timing—see engagement rise, not annoyance.
Can I combine churn prediction with my existing loyalty program?
Yes, and this is where the full value appears. The churn alerts tell you which players need attention; your loyalty program provides the mechanism to act. A player flagged as at-risk can receive a tier-protection reminder or a targeted loyalty offer automatically, closing the loop between prediction and action.
Does churn analytics work for new or small networks?
Yes. New players are scored against cohort baselines until personal history accumulates, and even small networks benefit from early detection. The value scales with your base, but the capability works from the first player. There is no minimum size for the model to begin learning.
How quickly do results appear after enabling churn analytics?
Early signals appear within the first month as the model calibrates to your base. Meaningful recovery-rate improvements typically materialize within 60-90 days, as the playbook is refined against real outcomes and the model accumulates your specific data.
Getting Started in Three Steps
Activating churn prediction is intentionally simple. First, enable the analytics module on your dashboard and let it begin learning your player base. Second, configure your alert sensitivity so the flags match your capacity to respond. Third, run your first weekly recovery review and start building the playbook from real results. The system compounds: more data means better predictions, better predictions mean more recoveries, and more recoveries mean a growing, stable base that needs less acquisition spending.
Conclusion: Predict the Future, Protect Your Base
The distributor who can see churn coming is the distributor who can stop it. AI churn prediction transforms retention from a reactive scramble into a proactive discipline. With panda master online game analytics, every distributor—regardless of technical background—gets the visibility and tools to recover players before they are lost. The economics are unambiguous, the implementation is straightforward, and the competitive advantage is compounding. Start predicting, and your player base will stop leaking.
Ready to see your retention risks before they happen? Contact the Panda Master team to enable AI churn prediction on your dashboard today.

Comments are closed